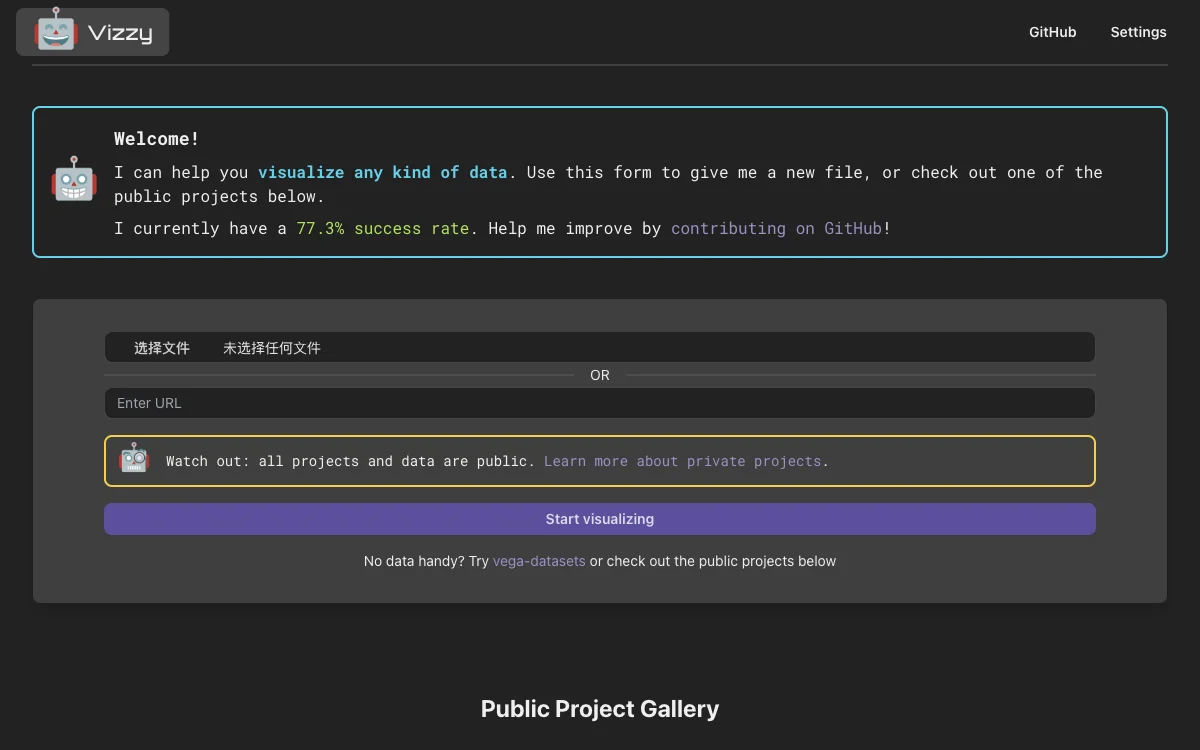
Vizzy stands out as a cutting-edge AI tool designed to transform the way we visualize data. Leveraging the power of Large Language Models (LLMs), Vizzy offers a seamless experience for users looking to bring their data to life. Whether you're a data scientist, a researcher, or just someone curious about data visualization, Vizzy provides an intuitive platform to explore and present data in visually compelling ways.
One of the key features of Vizzy is its ability to handle a wide range of data types, making it a versatile tool for various industries. From simple datasets to complex data structures, Vizzy's AI algorithms work tirelessly to ensure that your data is not only accurately represented but also easy to understand. This is particularly beneficial for those who may not have a deep background in data science but still wish to leverage the power of data visualization in their work.
Moreover, Vizzy encourages community involvement and continuous improvement. With a 77.3% success rate, the platform is constantly evolving, thanks to contributions from its user base on GitHub. This collaborative approach not only enhances the tool's capabilities but also fosters a sense of community among its users. Whether you're looking to contribute to the project or simply explore the public project gallery, Vizzy offers a welcoming environment for all.
In addition to its core visualization capabilities, Vizzy also provides access to a variety of public datasets, such as vega-datasets, allowing users to experiment and learn without the need for their own data. This feature is particularly useful for educational purposes or for those looking to get started with data visualization.
Overall, Vizzy represents a significant step forward in the field of data visualization. By combining the latest AI technologies with a user-friendly interface and a strong community focus, Vizzy is not just a tool but a comprehensive solution for anyone looking to explore the potential of their data.

