Bitcoin Visuals: Your Go-To Resource for Bitcoin Charts and Statistics
Bitcoin Visuals is an extensive platform dedicated to providing users with a wealth of information about Bitcoin through detailed charts and statistics. Whether you are a seasoned investor or just starting your journey in the cryptocurrency world, Bitcoin Visuals offers a variety of resources that can help you make informed decisions.
Key Features of Bitcoin Visuals
Comprehensive Dashboards
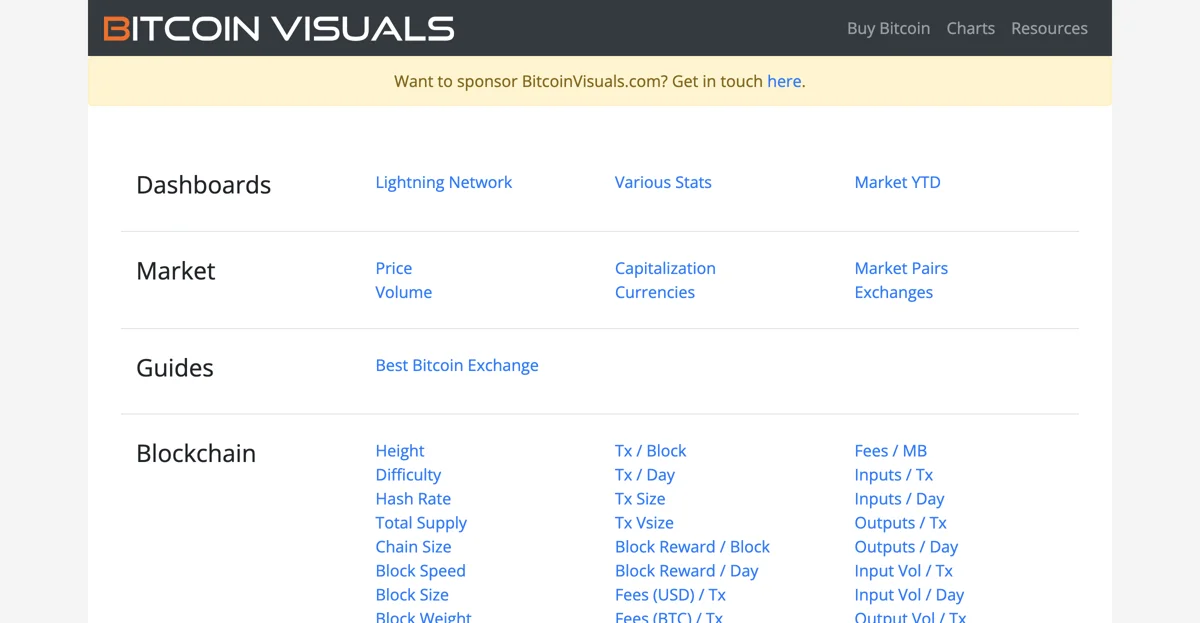
Bitcoin Visuals features a user-friendly dashboard that displays various statistics related to Bitcoin. You can easily track the market price, volume, capitalization, and other essential metrics. The dashboard is designed to provide a quick overview of the current market conditions, making it easier for users to stay updated.
Lightning Network Insights
One of the standout features of Bitcoin Visuals is its focus on the Lightning Network. Users can access data on Lightning nodes, channels, and capacity, which are crucial for understanding the scalability of Bitcoin transactions. This information is particularly valuable for those interested in the future of Bitcoin and its potential for mass adoption.
In-Depth Market Analysis
Bitcoin Visuals goes beyond basic statistics by offering in-depth market analysis. Users can explore metrics such as blockchain height, difficulty, hash rate, total supply, and transaction speeds. This level of detail allows users to gain insights into Bitcoin's performance over time and make predictions about future trends.
User-Friendly Charts
The platform provides a variety of charts that visually represent Bitcoin's performance. These charts are not only informative but also easy to understand, making them accessible to users of all experience levels. From transaction volume to block size, Bitcoin Visuals ensures that you have the data you need at your fingertips.
Educational Resources
For those new to Bitcoin, Bitcoin Visuals offers guides and resources to help you understand the complexities of cryptocurrency. Whether you're looking for the best Bitcoin exchange or want to learn about blockchain technology, the platform has you covered.
Pricing Strategy
Bitcoin Visuals offers a range of resources for free, but for those looking for advanced features and insights, premium options may be available. It's always a good idea to check their official website for the latest pricing information and subscription options.
Practical Tips for Using Bitcoin Visuals
- Stay Updated: Regularly check the dashboard for the latest market statistics.
- Utilize Charts: Make use of the various charts to visualize trends and patterns in Bitcoin's performance.
- Explore Educational Content: Take advantage of the guides and resources available to enhance your understanding of Bitcoin and blockchain technology.
Competitor Comparison
While Bitcoin Visuals is a robust platform, it's essential to consider other tools in the market. Competitors may offer different features or insights, so exploring multiple platforms can provide a more comprehensive view of the cryptocurrency landscape.
Frequently Asked Questions
Q: Is Bitcoin Visuals suitable for beginners?
A: Yes, the platform offers educational resources that cater to users of all experience levels.
Q: Are there any costs associated with using Bitcoin Visuals?
A: Many resources are free, but premium features may require a subscription.
Q: How often is the data updated?
A: Bitcoin Visuals strives to provide real-time data, ensuring users have the most current information available.
Conclusion
Bitcoin Visuals is an invaluable resource for anyone interested in Bitcoin. With its extensive charts, detailed statistics, and educational content, it empowers users to navigate the complex world of cryptocurrency confidently. Don't miss out on the opportunity to enhance your Bitcoin knowledge and trading strategies. Visit today and start exploring!

