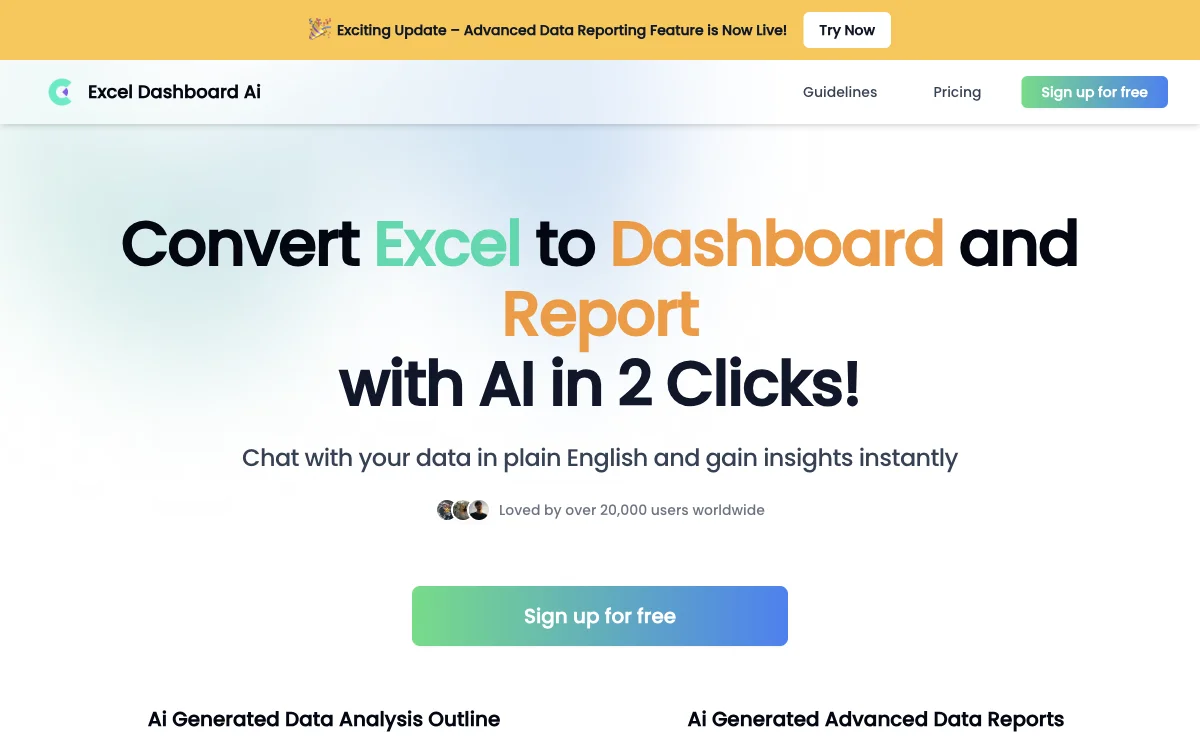
ExcelDashboard Ai revolutionizes the way we interact with Excel data by transforming it into dynamic dashboards and comprehensive reports with just a few clicks. This innovative tool leverages artificial intelligence to simplify data analysis, making it accessible to users of all skill levels. With ExcelDashboard Ai, you can chat with your data in plain English, ask questions, and receive immediate insights, eliminating the need for complex data analysis software.
One of the standout features of ExcelDashboard Ai is its ability to explore diverse data dimensions effortlessly. The AI generates multiple analysis perspectives in seconds, allowing users to select and lock in their preferred views using natural language commands. This flexibility ensures that users can tailor their data analysis to meet specific needs without requiring extensive technical knowledge.
Creating custom dashboards is a breeze with ExcelDashboard Ai. The tool handles all the programming and visualization, instantly producing interactive dashboards that highlight key information. Users can easily generate new charts with simple commands and add them to their dashboards with a single click. This feature not only saves time but also enhances the ability to present data in a visually appealing and understandable manner.
For those who need detailed reports, ExcelDashboard Ai offers the capability to convert all charts from a dashboard into a comprehensive, 20+ page report. The charts in these reports are fully editable, allowing for easy adjustments and customization. This makes ExcelDashboard Ai an invaluable tool for professionals who require detailed data analysis reports for presentations, meetings, or decision-making processes.
ExcelDashboard Ai is backed by a robust AI that interprets each chart's meaning, highlighting key information and enabling users to gain deeper insights into their data. The tool's ability to quickly re-generate new analysis dimensions and interactive dashboards ensures that users can explore their data from multiple angles, uncovering valuable insights that might otherwise remain hidden.
With over 20,000 users worldwide, ExcelDashboard Ai has proven to be a trusted solution for data analysis and reporting. Its user-friendly interface, combined with powerful AI capabilities, makes it an essential tool for anyone looking to enhance their data analysis workflow. Whether you're a business professional, researcher, or data enthusiast, ExcelDashboard Ai offers the tools you need to transform your Excel data into actionable insights.

