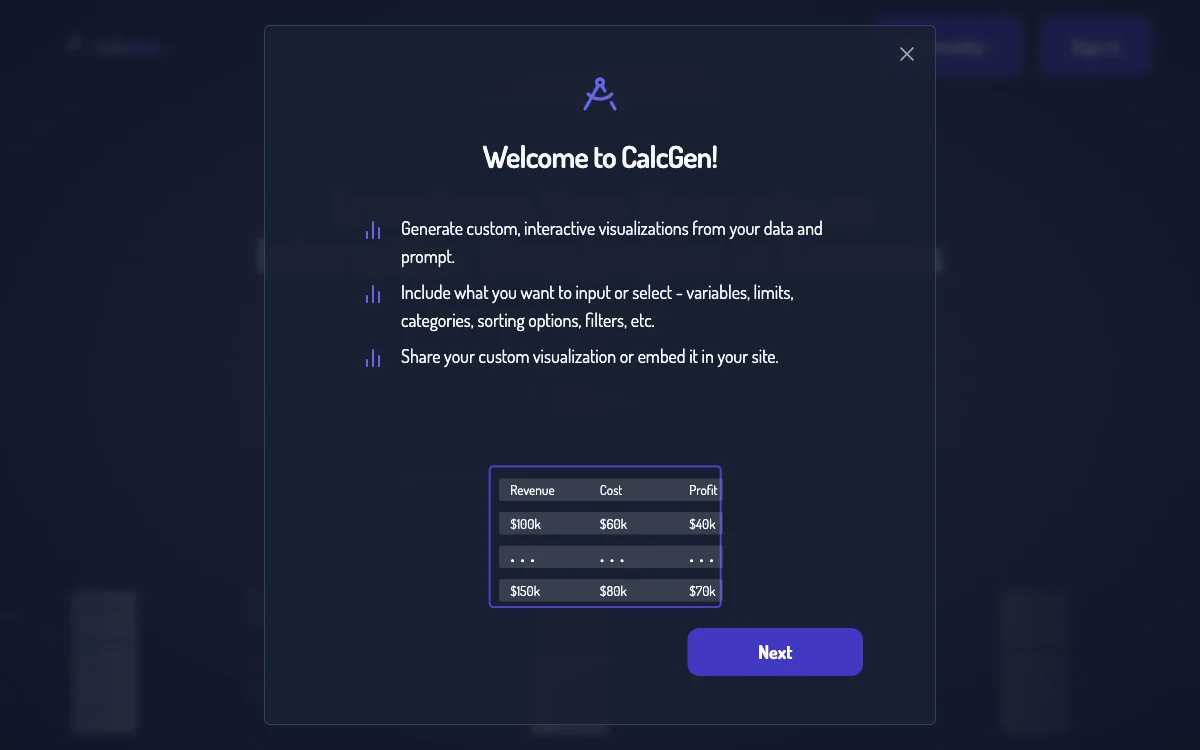
CalcGen AI stands at the forefront of data visualization and analysis, offering users the ability to create interactive charts, graphs, and calculators with unparalleled ease. This innovative tool leverages artificial intelligence to simplify complex data sets, making it an indispensable asset for professionals across various fields. Whether you're a finance manager looking to plot financial performance across multiple metrics, a demographer comparing population trends over centuries, or a scientist in need of a calculator for the ideal gas law, CalcGen AI has you covered. Its intuitive interface and powerful AI capabilities ensure that transforming raw data into meaningful insights is not just efficient but also enjoyable. With CalcGen AI, the barriers to sophisticated data analysis are significantly lowered, enabling users to focus more on deriving actionable insights rather than grappling with the intricacies of data visualization tools.

CalcGen AI
Discover CalcGen AI, the ultimate tool for transforming complex data into interactive visualizations, graphs, and calculators with ease. Perfect for professionals seeking efficient data analysis solutions.

Top Alternatives to CalcGen AI
SRI
SRI is an AI-powered R&D institute with diverse offerings
Atomic AI
Atomic AI is an AI-powered RNA drug discovery platform
Immunai
Immunai supports drug discovery with AI-powered solutions
EvoLogics
EvoLogics offers underwater communication and positioning solutions
Bethge Lab
Bethge Lab is an AI research group with diverse focuses
Receptive AI
Receptive AI enhances workplace inclusivity and psychological safety, boosting employee retention.
Galactica Demo
Galactica Demo is an AI-powered research tool designed for the scientific community to explore and reproduce AI research findings.
Quilter
Quilter is an AI-powered PCB designer that automates circuit board layout, optimizing designs for performance and manufacturing.
Labelbox
Labelbox is an AI-powered data labeling platform that helps users build better AI products remarkably fast.
Taalas
Taalas is an AI-powered platform that transforms AI models into custom silicon for 1000x efficiency.
Nextml
Nextml specializes in custom machine learning projects, enhancing satellite image analysis, railroad infrastructure damage detection, and text recognition in industrial settings.
Data Science & AI Workbench
Data Science & AI Workbench is a comprehensive platform that accelerates AI project development and deployment with robust security and governance.
Lambda | GPU Compute for AI
Lambda provides on-demand NVIDIA GPU instances and clusters for AI training and inference, designed for developers.
Granica AI
Granica AI enhances AI projects by optimizing data management for compactness, safety, and efficiency.
Azure Machine Learning
Azure Machine Learning is an enterprise-grade AI service that supports the end-to-end machine learning lifecycle, enabling businesses to build, deploy, and manage ML models at scale.
FlyPix
FlyPix is an AI-powered geospatial platform that helps users detect and analyze objects on Earth’s surface with precision.
Human or AI Game
Human or AI Game is an interactive platform that challenges users to distinguish between human and AI-generated images, contributing to academic research.
KBY
KBY-AI offers advanced SDKs for identity verification, including face recognition, liveness detection, and palm recognition, enhancing security and user experience.
VortiX
VortiX is an AI-powered search engine that helps users find precise scientific research papers with clear explanations.
Rayyan
Rayyan is an AI-powered platform that accelerates systematic and literature reviews, saving researchers significant time.
BioRaptor
BioRaptor is an AI-powered platform that helps scientists extract actionable insights from bioprocess data to enhance product development.